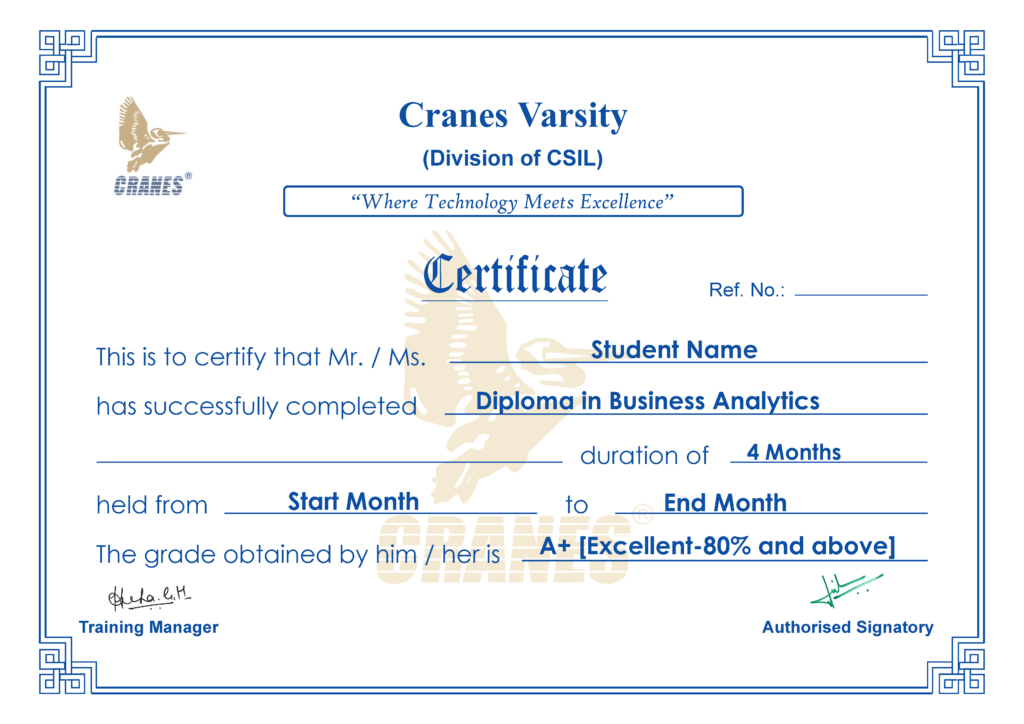
Diploma in Business Analytics
100% JOB Assured with Globally Accepted Certificate
Intermediate
Diploma in Business Analytics
100% JOB Assured with Globally Accepted Certificate
Overview
Certificate in Business Analytics
Description
Business Analytics Course For Working Professional
At Cranes Varsity – where we empower individuals to boost their careers with our top-rated Online/Offline Business Analytics Courses. Whether you are a working professional seeking to enhance your skills or a fresh graduate looking to enter the world of data-driven decision-making, our comprehensive program is designed to equip you with the knowledge and expertise needed to thrive in today’s data-driven business landscape.
Any person with or without analytic experience can certainly make a career transition into business analytics. While having a background in analytics or related fields can provide a head start, it is not always a prerequisite for entering the field of business analytics. While it may require some extra effort to transition into business analytics without prior experience, with determination, a willingness to learn, and a focus on acquiring the necessary skills, it is possible to establish a successful career in this field. A Business Analytics Certification Course will act as passport the industry for any interested professional.
Why Choose Our Certification Course in Business Analytics?
By completing this Business Analytics Certification Course, you will develop the skills necessary to work with data effectively, uncover valuable insights, and make data-driven decisions. These skills are highly sought after in various industries, including finance, marketing, healthcare, and more, opening up diverse career opportunities as a data analyst, business intelligence analyst, or data scientist.
In a Diploma in Business Analytics program, you will learn a diverse set of skills and knowledge essential for analyzing and interpreting business data. You will learn Database Management, Data Collection and Cleaning, Exploratory Data Analysis, Statistical Analysis, Data Visualization, Predictive Analytics, Machine Learning, Tableau and Industry case studies. This is an Online Business Analytics Course.
In this program you will gain an understanding of database concepts and learn to extract, manipulate, and query data using SQL. You will acquire hands-on experience with popular data analytics tools such as Excel, Python, and Tableau, enhancing your ability to work with and analyze data efficiently.
Our dedicated career support ensures job placement, connecting you with leading companies in the leading industries. With our strong industry connections, we provide dedicated career support and ensure job placement in leading organizations. Enroll now and pave your way to becoming a highly skilled Business Analyst.
Project stream:
- Application development based on Data Structure (Eg: Flood fund releasing data, cyber management systems, Bank management system, contact management system)
- Embedded Project development using wired/wireless technology such as GPS, GSM, BLE, Wi-Fi, and sensors
Any person with or without analytic experience can certainly make a career transition into business analytics. While having a background in analytics or related fields can provide a head start, it is not always a prerequisite for entering the field of business analytics. While it may require some extra effort to transition into business analytics without prior experience, with determination, a willingness to learn, and a focus on acquiring the necessary skills, it is possible to establish a successful career in this field.
In a Diploma in Business Analytics program at Cranes Varsity, you will learn a diverse set of skills and knowledge essential for analyzing and interpreting business data. You will learn Database Management, Data Collection and Cleaning, Exploratory Data Analysis, Statistical Analysis, Data Visualization, Predictive Analytics, Machine Learning, Tableau and Industry case studies.
In this program you will gain an understanding of database concepts and learn to extract, manipulate, and query data using SQL. You will acquire hands-on experience with popular data analytics tools such as Excel, Python, and Tableau, enhancing your ability to work with and analyze data efficiently.
By completing a Diploma in Data Analytics, you will develop the skills necessary to work with data effectively, uncover valuable insights, and make data-driven decisions. These skills are highly sought after in various industries, including finance, marketing, healthcare, and more, opening up diverse career opportunities as a data analyst, business intelligence analyst, or data scientist.
Our dedicated career support ensures job placement, connecting you with leading companies in the leading industries. With our strong industry connections, we provide dedicated career support and ensure job placement in leading organizations. Enroll now and pave your way to becoming a highly skilled Business Analyst.
Take Online Business Analytics Course from Cranes Varsity.
The Diploma in Business Analytics is a 5.5-month program that provides in-depth Business Analytics knowledge and expertise.
Cranes Varsity provides Business Analytics Course to Working Professionals.
In today’s economy, business analytics is a valuable instrument. Organizations generate huge amounts of data across industries, increasing the demand for data-literate employees who can read and analyze that data.
Multi-skilled professionals score more!
Cranes Varsity believes that with our unique technology-enabled experiential learning, we can provide high-quality learning and development solutions that directly impact important corporate performance indicators.
Cranes Varsity is happy to catalyze our distinguished clients’ advancement, and we value their credentials and testimonials.
All customer’s demands are identified, and training modules are created to meet their needs. Our training programs have a strong emphasis on creativity and innovation, which are critical for staying ahead of the competition and contributing to the industry’s long-term growth and managing and dealing with change in all aspects of the business.
Our services cover a wide range of topics, all professionally handled by a team of Learning and Development experts. All our training is Instructor-led Virtual /Classroom training with individual attention.
Cranes Varsity provides Working Professionals with a disciplined framework for learning and improving technical skills. They are well-planned and delivered using examples to make the lectures more fun and clear. We want to help working professionals build a broader set of skill development through rigorous upskill and reskill models.
Online Business Analytics Course with Placement
Cranes Varsity offers online and offline business analytics courses to help students build a solid career in the core domain connected with their objectives. We want to use digital tools to improve teaching and learning processes, whether for skill development or student placement.
Professionals can improve their expertise by taking a Certificate Course in business analytics at Cranes Varsity. At the same time, it aids in the development of their leadership abilities. This profile would be appropriate for a new business or a well-established one. Both of them require data analysis to help them build their respective companies.
What makes it even more tempting is that any professional with any background may become a business analyst and make critical decisions that alter the direction of enterprises.
Generic
- RDBMS using MySQL
- Python Programming
- Exploratory Data Analysis using Pandas
Data Analytics Specialization
- Mathematics and Statistics for Data Science
- Machine Learning using sklearn
- Formulating Business Analytics Problems
- Data Analysis and Visualization using Tableau / Power BI
- Data Analysis and Visualization using MS Excel
Projects
- Apply statistical methods to make decisions in various business problems, including bank, stock markets, etc.
- Apply regression
- Apply classification
- Use clustering to cluster banking customers
Platform
- Anaconda Distribution Jupyter, Spyder, MySQL
- Tableau, Excel
Business Analytics Course Modules
- Introduction to databases and RDBMS,
- Database creation, concept of relation and working examples Creating tables.
- Design view of the table, Alter table operations & Key Constraints
- Read, update and delete operations on tables. Working with nulls
- Querying tables: Select statement, examples and its variations
- Filtering, Sorting, Predicates and working examples
- Joins in SQL and working examples Insert, Update, Delete operations and working examples Scalar functions in SQL and working examples
- SQL set based operations and data aggregation
- Sub-queries in SQL
- Normalization and de-normalization: Views and Temporary tables
- Transactions in SQL
- SQL programming
- Creating stored procedures, Cursors in SQL
- EBS(Elastic Block Storage),VPC
- EBS volumes and Snapshots
- RDS
- Introduction to Python
- Python Data types and Conditions
- Control Statements
- Python Functions Default arguments
- Functions with variable number of args
- Scope of Variables
- Global specifier
- Working with multiple files
- List and Tuple
- List Methods
- List Comprehension
- Map and filter functions
- String
- List comprehension with conditionals
- Set and Dictionary
- Exception Handling
- File Handling
- Business Analytics Specialization
- NumPy
- Vectorization
- Broadcasting
- Slicing of Matrices
- Filtering Array Creation Functions
- NumPy Functions across axis
- Stacking of arrays
- Matrix Calculation
- Pandas Series
- Data Cleaning
- Handling Missing Data
- Pandas Data frame
- Selection Data (loc, iloc)
- Filtering Data Frames
- Working with Categorical Data
- Grouping & Aggregation
- Merging Data Frame(concat, merge)
- Sorting Data Frames
- Importing csv files
- Importing Excel Files
- Creating graphs using Matplotlib
- Customizing Plots
- Saving Plots
- Scatter Plot, Line Graph
- Bar Graph, Histogram
- Subplots
- Seaborn
- Matplotlib
- Logarithm
- Python Scipy Library
- Mean Absolute Deviation,
- Standard Deviation
- Probability and Distribution
- Normal Distribution and Z Score
- Descriptive and Inferential Statistics
- Binomial Theorem
- Visualizing Data
- Mean, Median, Mode
- Hypothesis testing
- Variance: ANOVA
- Percentile,
- Inferential Statistics
- Statistical Significance
- Log Normal Distribution
- Chi-square test, T test
- Data Preprocessing
- Standardization and normalization
- Ordinal, frequency encoding
- Transformation
- Understand what is Machine Learning
- Regression
- Logistic regression
- Supervised machine learning
- Simple linear regression
- Naïve Bayed Classification
- Unsupervised machine learning
- Multiple linear regression
- Decision tress and its types
- Train test split the data
- Performance measure for regression
- K Nearest Neighbour Classification
- ML Workflow for project implementation
- MSE, R-Squared, MAE, SSE Performance Measure for Classification
- Classification Various types of classification Accuracy,
- Recall, Precision, Fmeasure
- Tableau Introduction
- Traditional Visualization vs Tableau
- Tableau Architecture
- Working with sets
- Creating Groups
- Data types in Tableau
- Connect Tableau with Different Data Sources
- Visual Analytics Parameter Filters
- Cards in Tableau Charts, Dash-board
- Joins and Data Blending
- Tableau Calculations using Functions
- Building Predictive Models
- Dynamic Dashboards and Stories
- Introduction to excel
- Viewing, Entering, and Editing Data
- Introduction to Data Quality
- Intro to Analyzing Data Using Spreadsheets
- Converting Data with Value and Text
- Apply logical operations to data using IF
- Charting techniques in Excel
- Interactive dashboard creation
- Data analytics project using Excel
- Introduction to databases and RDBMS,
- Database creation, concept of relation and working examples Creating tables.
- Design view of the table, Alter table operations & Key Constraints
- Read, update and delete operations on tables. Working with nulls
- Querying tables: Select statement, examples and its variations
- Filtering, Sorting, Predicates and working examples
- Joins in SQL and working examples Insert, Update, Delete operations and working examples Scalar functions in SQL and working examples
- SQL set based operations and data aggregation
- Sub-queries in SQL
- Normalization and de-normalization: Views and Temporary tables
- Transactions in SQL
- SQL programming
- Creating stored procedures, Cursors in SQL
- EBS(Elastic Block Storage),VPC
- EBS volumes and Snapshots
- RDS
- Introduction to Python
- Python Data types and Conditions
- Control Statements
- Python Functions Default arguments
- Functions with variable number of args
- Scope of Variables
- Global specifier
- Working with multiple files
- List and Tuple
- List Methods
- List Comprehension
- Map and filter functions
- String
- List comprehension with conditionals
- Set and Dictionary
- Exception Handling
- File Handling
- Business Analytics Specialization
- NumPy
- Vectorization
- Broadcasting
- Slicing of Matrices
- Filtering Array Creation Functions
- NumPy Functions across axis
- Stacking of arrays
- Matrix Calculation
- Pandas Series
- Data Cleaning
- Handling Missing Data
- Pandas Data frame
- Selection Data (loc, iloc)
- Filtering Data Frames
- Working with Categorical Data
- Grouping & Aggregation
- Merging Data Frame(concat, merge)
- Sorting Data Frames
- Importing csv files
- Importing Excel Files
- Creating graphs using Matplotlib
- Customizing Plots
- Saving Plots
- Scatter Plot, Line Graph
- Bar Graph, Histogram
- Subplots
- Seaborn
- Matplotlib
- Logarithm
- Python Scipy Library
- Mean Absolute Deviation,
- Standard Deviation
- Probability and Distribution
- Normal Distribution and Z Score
- Descriptive and Inferential Statistics
- Binomial Theorem
- Visualizing Data
- Mean, Median, Mode
- Hypothesis testing
- Variance: ANOVA
- Percentile,
- Inferential Statistics
- Statistical Significance
- Log Normal Distribution
- Chi-square test, T test
- Data Preprocessing
- Standardization and normalization
- Ordinal, frequency encoding
- Transformation
- Understand what is Machine Learning
- Regression
- Logistic regression
- Supervised machine learning
- Simple linear regression
- Naïve Bayed Classification
- Unsupervised machine learning
- Multiple linear regression
- Decision tress and its types
- Train test split the data
- Performance measure for regression
- K Nearest Neighbour Classification
- ML Workflow for project implementation
- MSE, R-Squared, MAE, SSE
- Performance Measure for Classification
- Classification Various types of classification
- Accuracy,
- Recall, Precision, Fmeasure
- Tableau Introduction
- Traditional Visualization vs Tableau
- Tableau Architecture
- Working with sets
- Creating Groups
- Data types in Tableau
- Connect Tableau with Different Data Sources
- Visual Analytics Parameter Filters
- Cards in Tableau Charts, Dash-board
- Joins and Data Blending
- Tableau Calculations using Functions
- Building Predictive Models
- Dynamic Dashboards and Stories
- Introduction to excel
- Viewing, Entering, and Editing Data
- Introduction to Data Quality
- Intro to Analyzing Data Using Spreadsheets
- Converting Data with Value and Text
- Apply logical operations to data using IF
- Charting techniques in Excel
- Interactive dashboard creation
- Data analytics project using Excel
Generic
Relational Database – SQL – 6 Days
- Introduction to databases and RDBMS
- Read, update and delete operations on tables. Working with nulls
- Joins in SQL and working examples
- SQL set based operations and data aggregation, Sub-queries in SQL
- EBS(Elastic Block Storage),VPC
- Database creation, concept of relation and working examples
- Querying tables: Select statement, examples and its variations
- Insert, Update, Delete operations and working examples
- Normalization and de-normalization: Views and Temporary tables, Transactions in SQL
- EBS volumes and Snapshots
- Creating tables. Design view of the table, Alter table operations & Key Constraints
- Filtering, Sorting, Predicates and working examples
- Scalar functions in SQL and working examples
- SQL programming, Creating stored procedures, Cursors in SQL
- RDS
Python for Data Analytics – 6 Days
- Introduction to Python
- Python Functions
- Scope of Variables
- List and Tuple
- Map and filter functions
- Set and Dictionary
- Python Data types and Conditions
- Default arguments
- Global specifier
- List Methods
- String
- Exception Handling
- Control Statements
- Functions with variable number of args
- Working with multiple files
- List Comprehension
- List comprehension with conditionals
- File Handling
Exploratory Data Analysis with Pandas- 6 Days
- NumPy
- Slicing of Matrices
- NumPy Functions across axis
- Pandas Series
- Pandas Data frame
- Working with Categorical Data
- Sorting Data Frames
- Creating graphs using Matplotlib
- Scatter Plot, Line Graph
- Seaborn
- Vectorization
- Filtering
- Stacking of arrays
- Data Cleaning
- Selection Data (loc, iloc)
- Grouping & Aggregation
- Importing csv files
- Customizing Plots
- Bar Graph, Histogram
- Matplotlib
- Broadcasting
- Array Creation Functions
- Matrix Calculation
- Handling Missing Data
- Filtering Data Frames
- Merging Data Frame(concat, merge)
- Importing Excel Files
- Saving Plots
- Subplots
Data Analytics Specialization
Mathematics and Statistics for Data Science – 4 Days
- Logarithm
- Standard Deviation
- Descriptive and Inferential Statistics
- Linear Algebra
- Differential Calculus
- Chain Rule
- Python Scipy Library
- Mean, Median, Mode
- Percentile
- Log Normal Distribution
- PCA: principle component Analysis
- Probability and Distribution
- Binomial Theorem
- Hypothesis testing
- Mean Absolute Deviation
- Normal Distribution and Z Score
- Visualizing Data
- Variance: ANOVA
- Statistical Significance
- Inferential Statistics
- Chi-square test, T test
Machine Learning Using SK-Learn – 6 Days
- Understand what is Machine Learning
- Supervised machine learning
- Unsupervised machine learning
- Data Preprocessing
- Handling missing data
- Onehot Encoding
- Label encoding
- Ordinal, frequency encoding
- Standardization and normalization
- Train test split the data
- K fold cross validation
- Regression
- Simple linear regression
- Multiple linear regression
- Performance measure for regression
- MSE, R-Squared, MAE, SSE
- Feature selection for Regression
- ML Workflow for project implementation
- Classification
- Various types of classification
- Binomial and Bayes theorem
- Logistic regression
- Naïve Bayed Classification
- Decision tress and its types
- K Nearest Neighbour Classification
- Performance Measure for Classification
- Accuracy, Recall, Precision, Fmeasure
- Clustering and types
- Kmeans Clustering
- Evaluate clustering results, Elbow Plot
- Hierarchical clustering
- Project implementation
Formulating Business Analytics Problems – 8 Days
- Formulate BA problems
- Marketing and Customer analytics
- Financial and risk analytics
- Preparing business presentations with BI tools
- Analytics in Classic Business Problems
- Business Problems with Yes/No Decisions
- Strategy Analysis
- Analytics in Emergent Business Problems
- Churn in business, customer churn analysis
- Business matrices (BCG, Ansoff)
Data Analysis and Visualization Using Tableau / Power BI * –3 Day
- Tableau Introduction
- Working with sets
- Connect Tableau with Different Data Sources
- Cards in Tableau
- Tableau Calculations using Functions
- Traditional Visualization vs Tableau
- Creating Groups
- Visual Analytics
- Charts, Dash-board
- Building Predictive Models
- Tableau Architecture
- Data types in Tableau
- Parameter Filters
- Joins and Data Blending
- Dynamic Dashboards and Stories
Data Analysis and Visualization Using Excel –3 Day
- Introduction to excel
- Intro to Analyzing Data Using Spreadsheets
- Charting techniques in Excel
- Viewing, Entering, and Editing Data
- Converting Data with Value and Text
- Interactive dashboard creation
- Introduction to Data Quality
- Apply logical operations to data using IF
- Data analytics project using Excel
Hiring Partners



































Business Analytics Course FAQs
Will there be placements at the completion of the Business Analytics Course?
Yes, cranes will provide 100% placement assistance to all students who complete the BA course
What are the prerequisites for this Business Analytics Program?
There are no specific requirements for a Business Analytics Course, you have to be a graduate with good analytical thinking.
What kind of companies we can expect jobs from after completing this course?
As Business Analysts are required in every industry you can expect jobs from most of the top companies and others as well, as prominent recruiters like EY, Genpact, HCL, Capgemini, Deloitte, Target, etc.
What if I miss a Business Analytics lecture/session?
You will get a recorded session and also you can directly interact with the trainer and clarify your doubts
Who can join the Business Analytics Course?
Students from science, commerce, and engineering backgrounds can join, and also working professionals from any domain can join.
Testimonials
On completing my B. Tech in Computer Science and Engineering and as a fresher it was so difficult to get a better career. So, I joined Cranes Varsity for PG Diploma in Data Science and it really helped me a lot. I have learned a lot from the institution. The trainers are very professional and have in-depth knowledge about the subjects. The placement team is also very cooperative and provided me with good opportunities. I got placed in Onward Technologies Thanks to Cranes Varsity for helping me to get a better job.
I joined Cranes Varsity, in August 2021, after my engineering hoping to start my career in the Data Science domain. The trainers here are very supportive and have profound knowledge in modules like Basic and advanced python, DAV, ML, DL, Tableau, etc. They also evaluate student performance through mock tests and interviews. They provide a significant amount of placement opportunities in reputed companies. I am extremely grateful to the placement team, because of them I got placed in Kyndryl. If you are a fresher hoping to get a job in your favorite domain then the Cranes Varsity is the place for you.
I have completed my B.E in Mechatronics. As a fresher, it was very difficult to get a better career. So, I joined Cranes Varsity for doing Data Science Training Program and it has really helped me a lot. I learned a lot from Cranes Varsity. The trainers are very professional and have in-depth knowledge about the subjects. The placement team is also very cooperative and they provide a lot of opportunities. At last, I got placed in Tek systems Thanks to Cranes Varsity for helping me to get a better job.
I have completed B E in Mechatronics. I joined this institute in September 2021 for PG Diploma in Data Science in Cranes Varsity. The Trainers are good. Mock tests are regularly conducted to improve our technical and aptitude skills. They provide a many numbers of placement opportunities to all and they are very supportive and guide you for placement I got placed in TataElxsi. If we put in your right efforts in the training, you will get 100% placements.
I joined Cranes Varsity for Data Science Certification Courses after my engineering. I am 2021 passed out and I learned to start from basic python to advance python, Data analytics and visualization, RDBMS, ML, Tableau, etc. They provide multiple placement opportunities to all and they are very supportive and guide you for placement. I got placed in EY a big4 company with a very good package for a fresher. So if u need to learn new things and need placement Cranes Varsity is the best place for you.
I came to know about Cranes Varsity through Career labs as it approached my institute. Teaching in Cranes Varsity is good and for the Data Science Online Course, they covered modules like Python, Advanced Python, DAV, RDBMS, Tableau, Machine Learning and DL, Web technology, and Cloud Computing. Also, they provide many placement opportunities. They regularly have module and placement tests so that we can test our knowledge and do better in actual placements. I got placed in Genpact
Jagadeeshraju

Tushar Mishra

Mubashir

Arjun E

Dhanush Kumar S

Nikhil Gaikar

